Surviving launch-day traffic: a storefront at p95 38 seconds
A Next.js storefront on ECS hit p95 38s and 50k/min 5xx at peak. The cache stampede, sticky 404s and socket growth behind it, and the in-region k6 rig.

On this page
Play In The Box sells Korean fandom merch through gacha box openings, raffles and timed campaign drops. A drop is the whole business model, and it's also the worst possible traffic shape: nothing, then everyone at once, all asking for the same few pages.
On 2026-06-25 a peak hit the storefront and the frontend fell over. The numbers from that day, as the architecture doc records them: about 4.4k requests per second at the load balancer from only about 11k users, a frontend p95 of about 38 seconds, and about 50k 502/504 responses per minute. Demand for server-rendered pages was around 3k per second. The fleet, ten ECS tasks of 2 vCPU and 2 GB each running Next.js 16 in standalone mode, could serve somewhere between 500 and 2,000.
The ratio between those first two numbers is the interesting part. Four thousand requests a second from eleven thousand people means retries. The system was generating its own load. This post goes through why, what we changed, and the load rig we built so the next fix gets measured before a campaign instead of during one.
No single bug
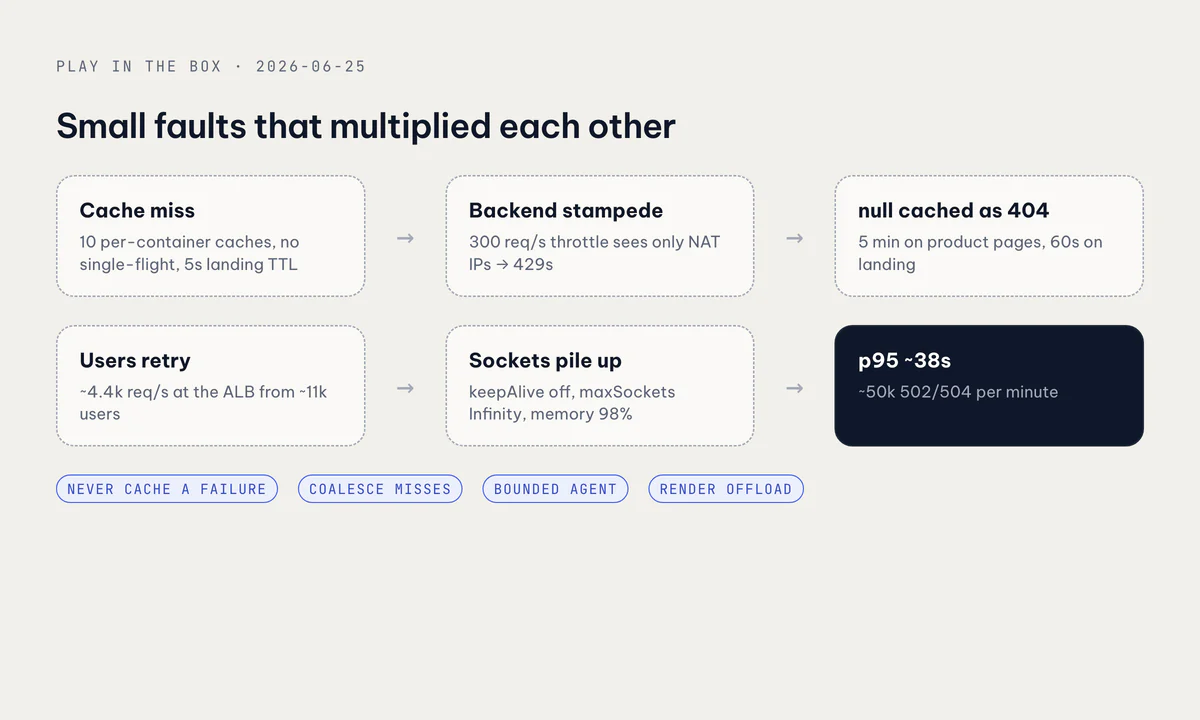
The incident report written afterwards makes a point I'd now put at the top of any postmortem: no one bug brought it down. It was a cluster of small application-level faults, each survivable alone, that multiplied each other. The report also says plainly what it can't claim. Pinning one root cause would need telemetry from the moment of the incident, and some of it didn't exist.
The cache stampede
The storefront cached backend data with Next's unstable_cache. That cache lives inside each container, in memory and on local disk. There was no shared cache handler, so ten tasks behind a non-sticky load balancer meant ten separate caches, and a given request had roughly a one-in-ten chance of landing where its entry was warm. Purging by tag only reached the container that handled the purge.
On top of that, Next doesn't merge concurrent requests for the same missing entry. When a hot entry expired, every in-flight request for it went to the backend at the same moment. The landing page data had a 5-second TTL. And the cache keys included the current date, so every entry in the fleet expired together at midnight UTC.
Sticky 404s
This was the one rated critical, because it hit the product page, which is where people buy. When the backend returned a transient error or a response the code couldn't read, the fetcher returned null. unstable_cache stored that null like any other value, for the product cache's full five minutes. So a perfectly good, in-stock product showed "not found" to every visitor for up to five minutes, while curl against the API returned it fine. It was intermittent and hard to reproduce, which made it miserable to explain.
The landing page had the same bug in a wider form: every error, including a 5xx, a network failure or a timeout, became null and was cached for 60 seconds. A one-second blip became a minute of missing landing page for everyone, and the users who saw it refreshed.
Unbounded sockets
Server-side rendering called the NestJS backend through axios, and axios used Node's global agent. In this setup that meant keepAlive: false and maxSockets: Infinity: a fresh TCP and TLS handshake for every call, and no ceiling on how many could be open at once. Under a spike, connections grew until file descriptors and memory ran out. Frontend memory peaked at 98%.
The amplifiers
Smaller things made all of the above worse:
- A leftover debug statement dumped the whole landing API response to stdout on every server fetch.
console.logis synchronous, so at peak it blocked the event loop, and it wrote about 185,000 CloudWatch records in three hours. - The backend throttled at 300 requests per second per IP. Behind a NAT gateway it only ever saw the frontend's egress IPs, so a per-user limit had quietly become a fleet-wide budget, and the overflow came back as 429s.
- A 15-second axios timeout let slow requests pile up instead of failing fast.
- The root layout forced every page dynamic, because of the CSP nonce, the session lookup and a cookie read. None of the app could be cached at the edge.
What we changed
Never cache a failure
The rule is simple: a cache stores successes only. A real not-found gets a short negative entry, and concurrent requests for the same key share one backend call:
const inFlight = new Map<string, Promise<Product>>();

function getProduct(key: string) {
  const pending = inFlight.get(key);
  if (pending) return pending;                // join the call already running

  const p = cachedFetch(key)                  // throws instead of returning null
    .finally(() => inFlight.delete(key));
  inFlight.set(key, p);
  return p;
}
Throwing instead of returning null is the important part. A thrown error is never written to the cache. On the landing page, re-throwing transient errors also means Next keeps serving the last good page while it revalidates in the background, so users see slightly old content instead of an error. A genuine not-found is rechecked after 15 seconds instead of five minutes.
The landing TTL went from 5 to 60 seconds, which still shows content edits within a minute. Footer settings, which turned out to be about 35% of all backend requests, got their own cache. Production builds now strip console.log, info and debug.
Bound the sockets
Every server-side call now goes through one agent with keep-alive and a ceiling:
const agent = new https.Agent({
  keepAlive: true,
  keepAliveMsecs: 15_000,
  maxSockets: Number(process.env.API_MAX_SOCKETS ?? 64), // per task
  maxFreeSockets: 16,
  scheduling: 'lifo',
});
Sixty-four sockets per task, across ten tasks, puts a known ceiling on what the frontend can open against the backend. Requests beyond it wait in Node's queue instead of opening yet another connection.
Render in the browser
The architecture doc I wrote proposed serving the public storefront from the CDN edge, with s-maxage and stale-while-revalidate per page type, a cache key of path plus locale plus market, and only 200s cached. That needed the root layout to stop forcing dynamic rendering. We built that decoupling, measured it, and reverted it. The static shell only flipped low-value pages to static, while pushing the product and collection pages back to dynamic. The one change that would have made those static was unsafe, because it would have baked default-market prices and a logged-out header into the cached HTML. What shipped instead, over 2026-06-26 and 27, was moving the bodies of the home, landing, gacha, raffle and catalog pages to render in the browser from direct API calls. The doc is blunt about where the headroom came from: "from the render offload, not from caching". The CloudFront that did ship is an image CDN with long TTLs in front of product images.
I think that's worth saying out loud. The design I was most attached to wasn't the one that paid off.
Scale on the right signals
On the infrastructure side the ECS services got target-tracking policies on CPU (target 60%), ALB requests per target, and frontend memory, with a 60-second scale-out cooldown and a 300-second scale-in cooldown. The backend minimum went up to 4 tasks with a maximum of 10, frontend tasks went from 2 GB to 4 GB, and Redis moved to ElastiCache.
Four days after the first incident there was a second one, a health-check death spiral that explicitly wasn't an out-of-memory problem. Under load, server rendering was CPU-bound. Round-robin balancing let one task run hot while the service average stayed low, its health check timed out, ECS killed a task that was busy but alive, and the load shifted onto the next one. The fixes were switching the load balancer to least_outstanding_requests, a 10-second health-check timeout with an unhealthy threshold of 5, and pre-warming the minimum task count before a campaign. The runbook sums it up in one line I keep coming back to: a healthy task count is not healthy performance.
A load rig that lives next to the servers
Load testing from a laptop measures the laptop's network. We built the rig in the same AWS region as production: an EKS cluster made with eksctl, three c5.2xlarge spot nodes, about 1 ms round trip to the target. k6-operator runs the test as 8 parallel runners at a peak of 400 requests per second each, about 3,200 RPS in total.
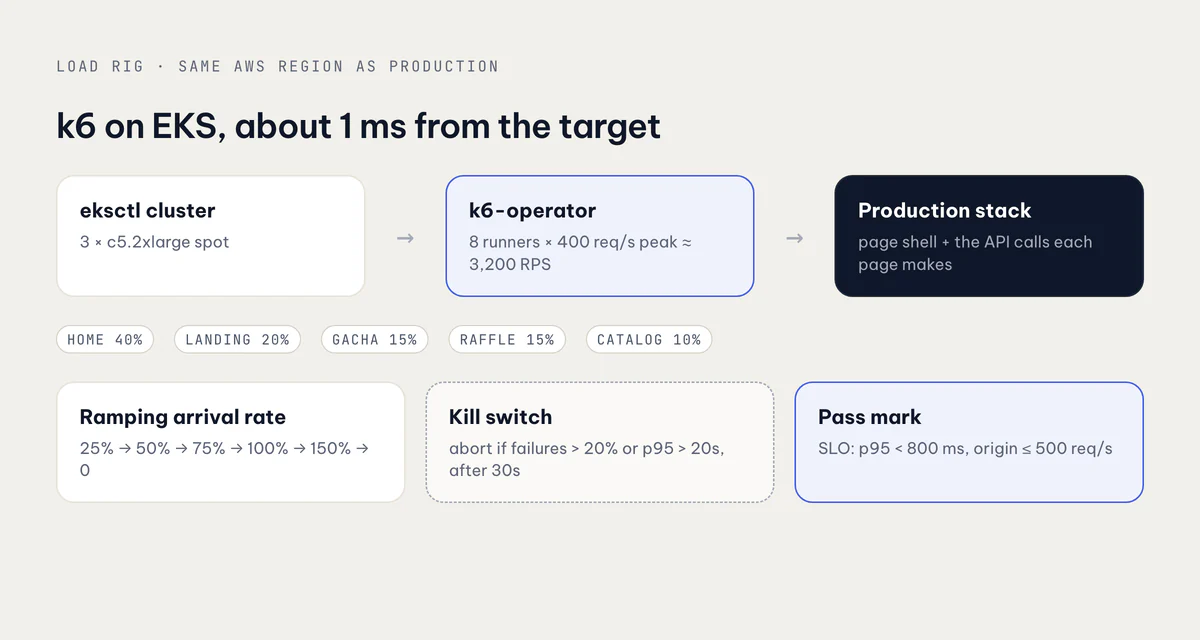
The scenario is a ramping arrival rate, not a fixed number of virtual users, because a drop is defined by arrivals:
export const options = {
  scenarios: {
    drop: {
      executor: 'ramping-arrival-rate',
      preAllocatedVUs: Math.max(100, PEAK),
      maxVUs: PEAK * 6,
      stages: [
        { target: PEAK * 0.25, duration: '30s' },
        { target: PEAK * 0.5,  duration: '1m'  },
        { target: PEAK * 0.75, duration: '1m'  },
        { target: PEAK,        duration: '2m'  },
        { target: PEAK * 1.5,  duration: '1m'  },
        { target: 0,           duration: '30s' },
      ],
    },
  },
  thresholds: {
    http_req_failed:   [{ threshold: 'rate<0.20', abortOnFail: true, delayAbortEval: '30s' }],
    http_req_duration: [{ threshold: 'p(95)<20000', abortOnFail: true, delayAbortEval: '30s' }],
  },
};
Each iteration is a real journey: the page shell plus the API calls that page makes, weighted 40% home, 20% landing, 15% gacha, 15% raffle and 10% catalog. Custom counters split responses into 200, 429, 5xx, 502/503/504 and timeouts, because "errors went up" tells you nothing until you know which kind.
The thresholds are a kill switch, not a pass mark. It's a test against the real production stack, so if more than 20% of requests fail or p95 passes 20 seconds, it stops itself after a 30-second grace period. The pass mark lives in the design doc's SLO table: p95 under 800 ms, origin under 500 requests per second, effectively zero 5xx.
What I'd do again
- Divide requests by users. A request rate far above what your user count explains means the system is generating its own load.
- Never cache
null. Throw on failure so the cache can't store it, and give real not-founds a short negative TTL. - Coalesce misses. Per-container caches with no single-flight turn every expiry into a stampede.
- Don't put the date in a cache key unless you want the whole fleet to expire at midnight.
- Set an HTTP agent on every server-side client. Keep-alive plus
maxSockets, sized against the backend. - Check what the backend's rate limit actually sees. Behind NAT, per IP can mean per fleet.
- Strip debug logging from production builds. Synchronous logs are a load multiplier.
- Load test from inside the region, with arrival-rate scenarios, real journeys, and abort thresholds.
- Be ready to drop your favourite design. Measure it; ship what moves the numbers.
More on the platform and my role in it is in the Play In The Box case study.
Related posts